Cloud FinOps — Part 4: Kubernetes Cost Report

This article was originally published on Medium - Empathy.co.
After covering FinOps Principles, Tag Allocation Strategy, and Cloud Cost Report, let's explore gaining cost visibility on Kubernetes Workloads.
Motivation
Nowadays, a lot of companies run their workloads on Kubernetes because there are many benefits to choosing Kubernetes as the main solutions orchestrator for microservices. Although there is some visibility of cloud costs from the main public cloud provider, costs from within the Kubernetes cluster tend not to be clearly defined.
Some solutions have already been created to tackle this lack of data, such as Vantage.sh and Kubecost, and gain Kubernetes Cost Visibility. Before going ahead with this solution proposal, the Platform Engineering team Empathy.co explored two Kubecost options: Kubecost as a Prometheus metric explorer and the Kubecost Helm Chart.
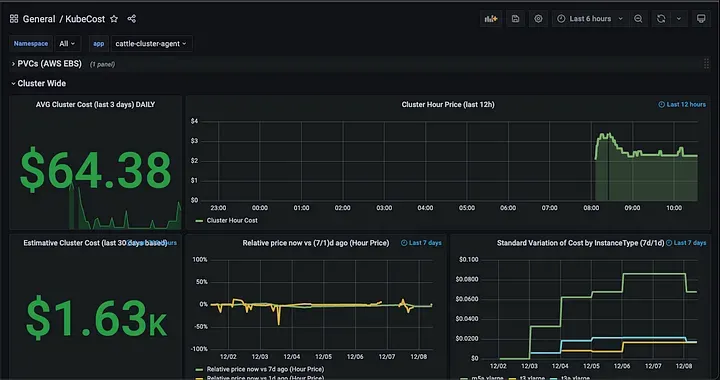
In the graphs above, Kubecost doesn’t show the same cost per cluster, nor is the price correlated with those in AWS Cost Explorer:
- Kubecost reports approximately $65/day
- AWS Cost Explorer reports around 2.40/day for EKS Free
It’s a significant difference, therefore we investigated other approaches as we began to create our own dashboards, based on autoscaling instance type info.
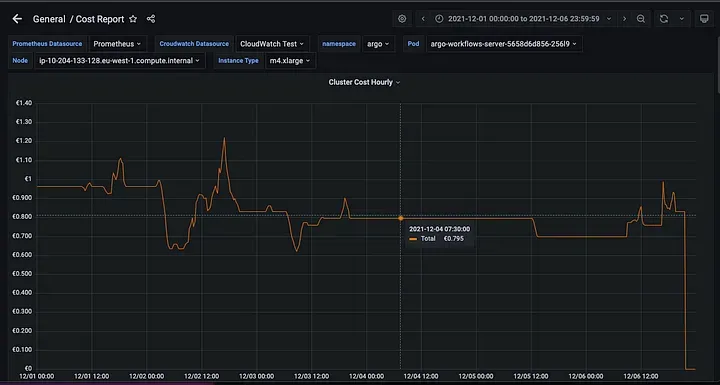
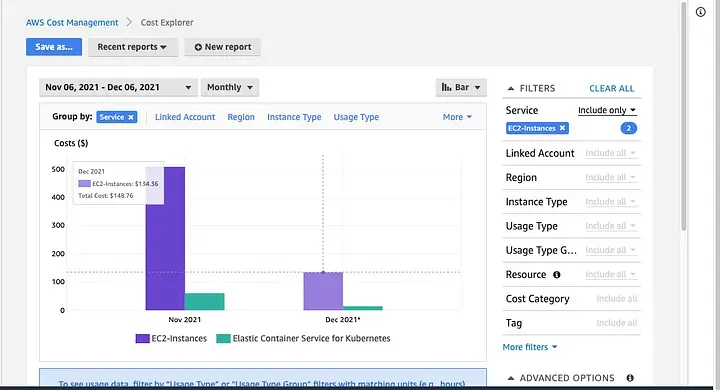
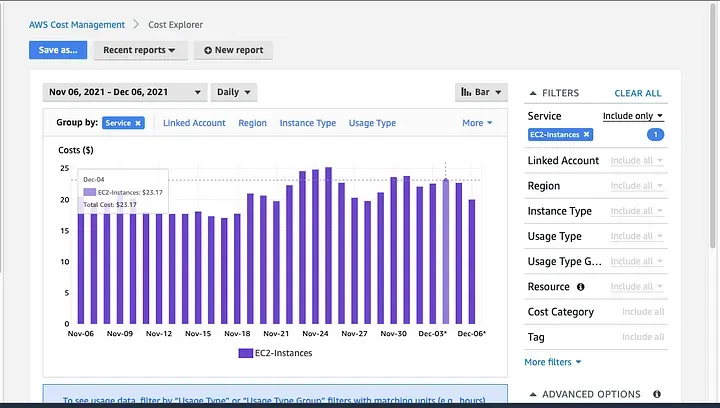
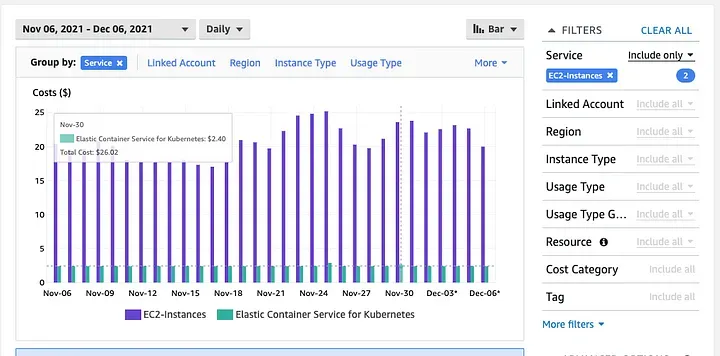
Calculating the average of the first week of December 2021, based on the Autoscaling instance type, the corresponding costs using the following tools are:
- Grafana Dashboard
- 133.56/week**
- AWS Cost Explorer
- Around $134.36/week
Based on these calculations, Grafana Dashboard provides a more accurate cost overview than Kubecost does. At the same time, it does not require any type of dependency and the solution is completely autonomous.
Architecture
Basic Structure
AWS Cost Explorer API incurs a charge of $0.01 per each paginated API request, and does not provide information in real time.
Based on cluster autoscaler info, we can apply a service to the AWS Pricing API to determine the cost per month/day/hour. Additionally, we could identify the equivalent core — GB ram per node. The goal is to have a fairly approximate idea of workload cost.
High Level Diagram
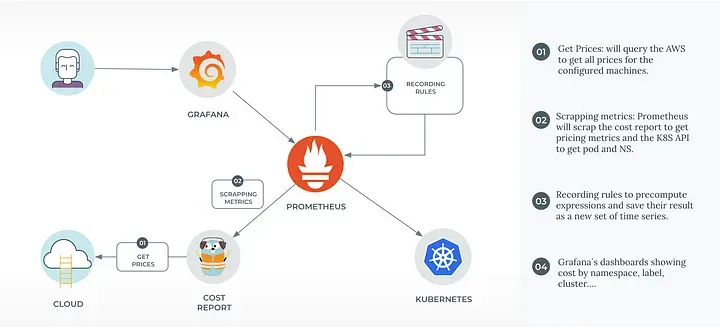
The above approach looks pretty simple: an app that exports cost metrics to Prometheus provides all the necessary dashboards in Grafana. Prometheus and Grafana are part of our monitoring stack, as they are for the vast majority of software companies nowadays. Therefore, after testing the solution at Empathy.co, we decided to make it open source so as to contribute to the community and embrace feedback.
Check out our repository on how to implement Kubernetes Cost Report using an EKS cluster.
The Kubernetes Cost allocation can be split into multiple layers:
- Cluster Cost: The sum of the cost of each node
- Namespace Cost:
- The Namespace Cost concept is usually used on Kubernetes to handle a group of pods, which can run in multiple nodes. The cost can be split into:
- Namespace Resource Requests: The sum of resources requests for each pod
- Namespace Resources Used: The sum of resources used for all the pods in that namespace
- Pod Cost:
- Each pod requests different resources, so the cost can be split into:
- Resource Requests: What each pod requests
- Resources Used: What each pod really used
- Each pod requests different resources, so the cost can be split into:
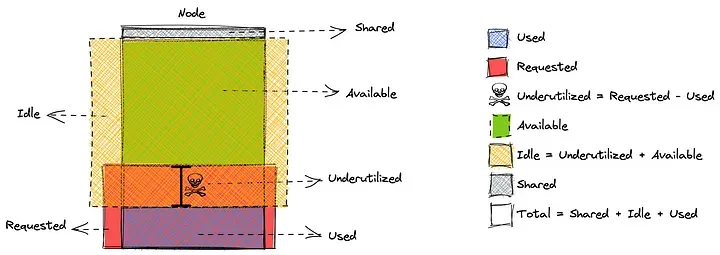
The following diagram illustrates the difference between requests and usage.
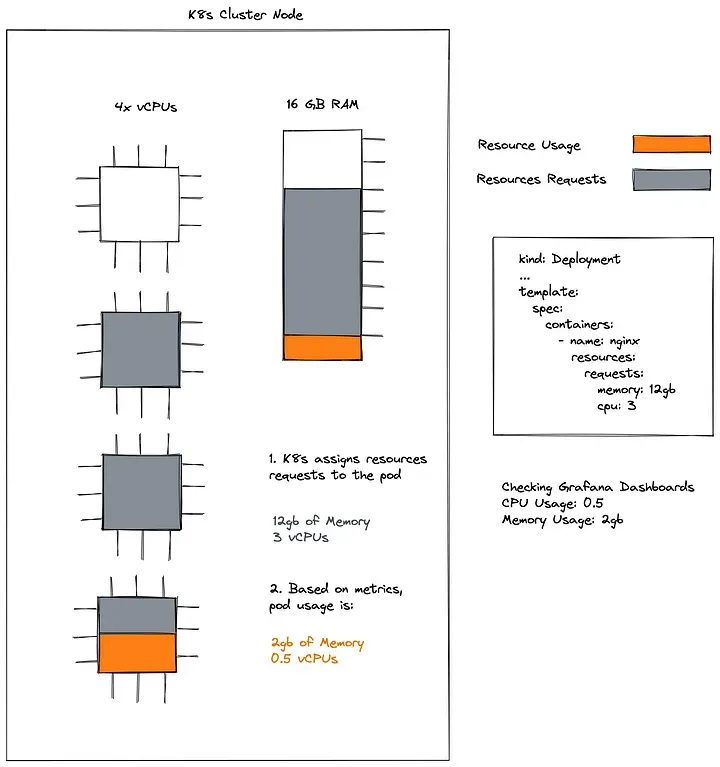
Resource Requests are those that are added to the final invoice, but knowing the usage allows underutilization to be measured and determine how much can be saved by doing a pod rightsizing.
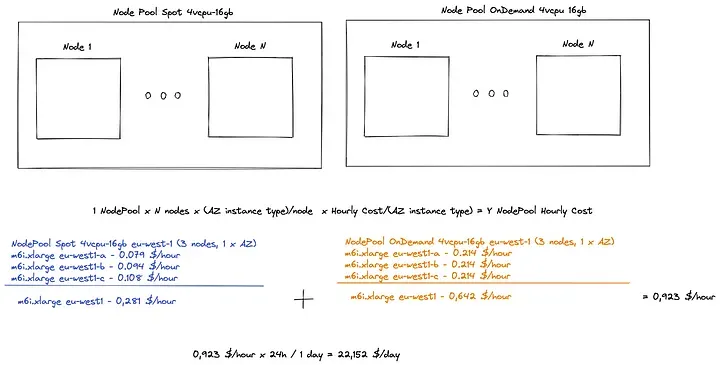
### Total Cluster Cost & Taxonomy
Knowing the instance type and the availability zone, the cost is simply a sum between different values based on the cost report deployment (the value of which is calculated by the AWS Pricing API every 12 hours).
The total cluster cost presented above can be divided into a number of different costs, attending to their origins (that is, the resources they originate from):
- Usage Costs: As outlined above, these costs are related to the actual usage of resources coming from each pod.
- Request Costs: Stemming from the resource requests of each pod, as these requested resources have to be guaranteed.
- Underutilization Costs: As explained above, the difference between the resources a pod requests and those that it actually uses is labeled as underutilization. This difference is reserved for a given pod, even though it is not using it; so, no other pod can make use of it. In a sense, said pod is “hoarding“ but not actually using these resources. Hence, these costs can be calculated as Request Costs/Usage Costs.
- Available Costs: Related to the resources that no pod is reserving, hence available for any pod to use, i.e., to accommodate new workloads or spikes in currently running pods. It may seem tempting to reduce Available Costs to zero in order to reduce total costs, yet having a relatively small amount of Available Costs (and, therefore, available resources) is good practice to easily accommodate spikes in workloads or new workloads.
- Idle Costs: Originating from resources that are not being used in any sense, these costs encompass both Underutilization Costs and Available Costs (resources that are available for pod to use, but are not actually in use). These costs can be calculated as Underutilization Costs + Available Costs. The ideal situation would be to eliminate Underutilization Costs, so that Idle Costs = Available Costs. This situation basically means that no workload is “hoarding“ resources, and the idle resources that are at the ready can be used for spikes in workloads or new workloads.
- Shared Costs: These costs arise from resources that the actual Kubernetes cluster reserves for itself in order to work properly. No workload can use these resources, yet it is a price that must be paid for the cluster to work (think of these costs as the service costs, e.g., in your water bill — service availability, sewer charges, etc.). So, while we call them “Shared“ in the sense that they are not associated exclusively with any workload, they are costs that have to be paid by all workloads, in order to have a Kubernetes cluster. There is much more to be learned about allocatable resources.
To summarize the taxonomy, here’s a visual representation of one node and one pod running in that node:
Implementation
Open Source Solution
We've made our solution open source:
Grafana Dashboards
Two dashboards available:
- Executive Summary
- High-level cost overview
- Key metrics visualization
- Detailed Cost Report
- In-depth analysis
- Resource utilization
- Cost breakdown
Future Developments
- Enhanced Cost Analysis
- Underutilization cost impact
- Spot instance optimization
- Minute-precision tracking
- Sustainability Focus
- Energy efficiency reports
- Carbon footprint tracking
- Advanced Features
- Multi-cluster support
- Custom pricing models
- Predictive analytics
Key Takeaways
- Improved Visibility
- Real-time cost tracking
- Workload-level insights
- Actionable Insights
- Resource optimization
- Cost allocation
- Budget planning
- Business Value
- Data-driven decisions
- Resource accountability
- Cost optimization
Resources
- Analyzing your costs with AWS Cost Explorer — AWS Cost Management
- GitHub — kubecost/cost-analyzer-helm-chart: Kubecost helm chart
- GitHub — cost-model/kubecost-exporter.md at develop · kubecost/cost-model
- Prometheus Cheat Sheet — How to Join Multiple Metrics (Vector Matching)
- Understanding Kubernetes Limits and Requests | Sysdig
- GitHub — empathyco/kubernetes-cost-report: Cost Report service for Kubernetes
About the Author
I'm a Platform Engineer Architect specializing in cloud-native technologies and engineering leadership. With extensive experience in cloud cost optimization and FinOps practices, I help organizations build efficient and cost-effective cloud infrastructure.
Connect with me on LinkedIn or contact me for more information.


